FaceMash. What is now the largest social media platform in the world launched in 2003 with the sole purpose of trolling college girls — a solid business venture with a fitting title.
A decade and a half later (and with an appropriate name change), an investor relations report for Q4 2018 reports that Facebook has grown larger than ever. At 2.32 billion monthly active users, any business not running a Facebook business page is doing so at a disadvantage.
The platform continues to expand well into the billions of users, and here are the most crucial, up-to-date statistics that will help you justify your investment in Facebook as a platform to market your business in 2019.
Facebook statistics in 2019
With so many social media platforms available, Facebook marketing seems to be less of a focus these days. Here’s a list of all the Facebook statistics about how important Facebook still is in the marketing world.
Worldwide Facebook usage statistics
- Facebook is still the largest social media platform in terms of worldwide user activity. A total record of 2.32 billion monthly active users was announced by Facebook’s Investor Relations earnings call from January 30th of 2019 (IR Report, 2019).
- Compared to 2017, daily active users have increased 9%, an increase of 2.72 million at the end of Q4 2018 (IR Report, 2019).
- 1.52 billion of these users log into Facebook daily, this is 66% of their monthly active users from the same report, and also marks a 9% increase compared to 2017 (IR Report, 2019).
- An estimated 2 billion people are estimated to use at least one app in the Facebook services group daily (IR Report, 2019).
- Facebook internal reports estimate a total of 2.7 billion unique users within their app “Family”. This consists of Facebook, Instagram, WhatsApp, and Messenger (IR Report, 2019).
- An internal report estimates that between 3% and 4% of monthly active users are fake accounts as of November 2018 (Facebook Newsroom, 2018).
- Facebook Marketplace is used by more than 800 million users with most using the platform to buy and sell vehicles online (Facebook Newsroom, 2018).
- 2.5 billion content items are shared daily, which can be tough for Facebook to keep track of. This is why its content moderation team has grown to more than half of the 30,000 on their security and privacy team (IR Report, 2019).
- Visual marketing is growing in line with consumer activity. 300 million photos are uploaded daily to Facebook (Facebook IQ, 2018).
- A 7-year-old study from CNET tracked data being uploaded to Facebook and reported that the company manages more than 500 TB of data every day. The number has surely more than grown (CNET, 2012).
U.S. Facebook usage statistics
- Higher income demographic groups were more likely to have reported Facebook use. 75% of U.S. adults whose income is higher than $75k said they use Facebook, relative to respondents whose income was below 30k, who averaged 66% (Pew Research, 2018).
- As a result of privacy implications within the past 12 months, 54% of users surveyed are reported to have adjusted privacy settings (Pew Research, 2018).
- 76% of adults surveyed claim to have either deleted the app from their phone, drastically reduced usage over an extended period, or adjusted privacy settings within the past 12 months (Pew Research, 2018).
- American adults lack an understanding of how the Newsfeed works. 20% of those surveyed did not understand the content curation process at all (Pew Research, 2018).
- 57% of Facebook users surveyed believe they have very limited control over what Newsfeed posts they are shown (Pew Research, 2018).
- Of all Facebook users in North America, 60% are connected to a business in another country (Facebook IQ, 2018).
Regional Facebook usage statistics
- Facebook connects users to business pages every day. Approximately 1+ billion users are connected to a business that’s not in their country(Facebook IQ, 2018).
- 2/3rds of shoppers on Facebook have made international purchases (Facebook IQ, 2018).
- 75% of shoppers in the U.K. are connected with businesses in another country (Facebook IQ, 2018).
- 360 million Facebook users have participated in e-commerce transactions outside of their country (Facebook IQ, 2018).
- In Brazil, 89% of Facebook buyers surveyed messaged a business to gather more information on a product or service (Facebook IQ, 2018).
- Asia-Pacific consists of the largest user group demographic. Providing 947 million of Facebook’s monthly active users, contributing to approximately 41% of the total Facebook community (IR Report, 2019).
- 7. 55% of people surveyed in a user study conducted by Facebook felt they were more personally connected to a brand after directly messaging them (Facebook IQ, 2018).
Facebook video statistics
- Facebook Watch has reached 400 million monthly active users, as the company tries to provide alternate video consumption sources to the News Feed (Facebook Newsroom, 2018).
- Over 75 million monthly active users watch at least one minute of video daily (Facebook Newsroom, 2018).
- The average amount of time spent watching video between these daily active viewers is more than 20 minutes (Facebook Newsroom, 2018).
- Facebook’s Watch Party feature for groups now has seen more than 12 million events since launch (Facebook Newsroom, 2018).
- These videos are watched in real time within a user group and tend to drive 8x more comments than regular videos as a result (Facebook Newsroom, 2018).
- More than 50 million people in the U.S. use Facebook Watch every month, a 14x increase since the start of 2018 (Facebook Newsroom, 2018).
- Daily watch time for Facebook Live broadcasts grew 4X over the course of a year (Facebook IQ, 2018).
- A 2015 study estimated that a total of 8 billion video views are hosted on Facebook daily (The Verge, 2015).
- Users spend 16.7 seconds on average watching videos in their Newsfeed (Business Insider, 2018).
- 100 million hours of video are viewed on Facebook daily (TechCrunch, 2016).
- An internal report from Cisco predicts that by 2020, more than 75% of worldwide traffic will be video (Facebook IQ, 2018).
Facebook app family ad statistics
- The ad platform sees more than 7 million active users across all of Facebook’s services (Facebook IQ, 2018).
- 2 million of these advertisers are using stories to reach customers across the range of Facebook’s app family (Facebook Newsroom, 2018).
- Internal reports claim that 1.6 billion people are now connected to a small business on the social media platform (Facebook IQ, 2018).
- Seven of ten tests showed that vertical video ads drove an incremental increase in brand lift, including a three- to nine-point increase in ad recall (Facebook IQ, 2018).
- Three times more people were engaged with an ad when a brand name and message were presented in the first 10 seconds of a video ad (Facebook IQ, 2018).
- When combining Facebook and Audience Network for mobile app campaigns, advertisers saw, on average, a 17% increase in installs (Facebook IQ, 2018).
- On average, Facebook ads were responsible for 19% more organic search-referred site visits and 10% more for paid search-referred visits vs. when people didn't see Facebook ads (Facebook IQ, 2018).
- Revenue per visit is close to double that of competing social media websites per visit, according to reports provided by Adobe Systems (Statista, 2018).
- Average Revenue per user in the U.S. and Canada far outweighs worldwide and regional metrics, at $34.09 per user. The next closest is Europe, at $10.82 ad revenue per user (IR Report, 2019).
Facebook Messenger statistics
- 10 billion messages are exchanged between people and businesses every month on Facebook Messenger (Facebook IQ, 2018).
- More than 1.3 billion people use Facebook Messenger each month (Facebook IQ, 2018).
- 20+ million businesses have communicated with customers through Facebook Messenger (Facebook IQ, 2018).
- Facebook users surveyed were more than 70% likely to message a business about customer service questions (Facebook IQ, 2018).
- People surveyed felt they received a faster response rate through Facebook Messenger, relative to traditional communication channels, more than 59% of the time (Facebook IQ, 2018).
Facebook Audience Network ad statistics
- Audience Network video ads that are 15 seconds (or shorter) are watched to completion 75% of the time (Facebook IQ, 2018).
- Audience Network video ads that are 30 seconds (or shorter) are watched to completion 70% of the time (Facebook IQ, 2018).
- Removing Audience Network as a placement from app install or conversion campaigns may result in 15% fewer app installs or conversions on average (Facebook IQ, 2018).
- 32% of the top 500 free apps on Google Play in the US monetize with Audience Network (Facebook IQ, 2018).
- 80% of in-stream video impressions on Facebook Audience Network result in views ten seconds or longer on Facebook (Facebook IQ, 2018).
Facebook SEO statistics
- A simple Google search using site operators reveals 1.09 billion pages are currently active in Google’s index under the Facebook.com domain (Google, 2019).
- Facebook is estimated to be the #3 most trafficked website on the web (Alexa, 2019).
- Facebook holds the longest average daily time on site (9:33) among other top 10 ranked sites on the web (Alexa, 2019).
- An estimate of 4 (3.97) unique page views are made per daily visitor based on data from the past 3 months (Alexa, 2019).
- Search engines source an estimated 7.5% of Facebook’s referrals to the site (Alexa, 2019).
- Facebook ranks #1 in terms of overall backlink structure, with 23.5 million unique domains indexed sourcing a link to it, and over 66.5 billion individual links pointing towards the domain (Ahrefs, 2019).
- The keyword “Facebook” is estimated to have an average of 338 million searches per month (SEMrush, 2019).
- Facebook sees over 2 billion searches across 2.5 trillion Newsfeed posts according to an earnings call in 2016 (IR Report, 2016).
- Facebook’s search engine is the 4th largest in the world, trailing only Google, YouTube, and Amazon in terms of daily search volume (SEJ, 2018).
Facebook social media statistics
- Facebook ranks 3rd for the highest overall rated Social Networking platforms in terms of online reviews (G2.com, 2019).
- 92% of users reported that Facebook’s business platform meets their ease of use requirements and expectations (G2.com, 2019).
- Reviewers rated Facebook the easiest to use Social Networks Software over platforms like Snapchat, Pinterest and LinkedIn (G2.com, 2019).
- 74% of American Facebook users visit the site at least once a day (Pew Research, 2018).
- 43% of adults in the U.S. get their news on Facebook (Statista, 2018).
- Facebook’s most popular fan pages in 2018 were Facebook (213 million), Samsung (159 million), and Cristiano Ronaldo (122 million) (Statista, 2018).
- The number of Facebook users aged 65 and over has doubled to 41% since 2012 (Ofcom, 2017).
- Facebook videos that are mobile optimized increase brand awareness by up to 67%(Facebook Newsroom, 2018).
Facebook business statistics
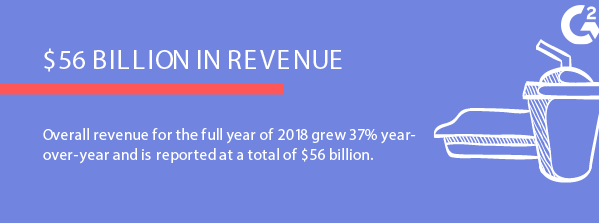
- Overall revenue for the full year of 2018 grew 37% year-over-year and is reported at a total of $56 billion (IR Report, 2019).
- Advertising is Facebook’s bread and butter, with 98% of its Q4 2018 revenue coming from this source (IR Report, 2019).
- A relatively marginal 2% of revenue comes from payments and other fees (IR Report, 2019).
- Mobile ad revenue generated a whopping 93% of the overall advertising revenue for Facebook, a 4% increase in Q4 2018 year-over-year (IR Report, 2019).
- Facebook employs a total number of 35,587 workers as of January 30th, 2019. This is a 42% increase from end-of-year 2017 (IR Report, 2019).
- Cash and near-cash liquid assets sit at $41.11 billion at the end of the 4th quarter for Facebook, down from $41.71 billion in Q4 2017 (IR Report, 2019).
- US & Canada generated $8.246 billion in advertising revenue in Q4 2018, contributing to approximately half (49.6%) of all advertising revenue across all geographic regions (IR Report, 2019).
- Worldwide average revenue per user (ARPU) increased $1.19 from Q4 2017 and is now at $7.37 after the end of Q4 2018. The revenue distribution between advertising and payments and other fees is consistent with overall revenue numbers (IR Report, 2019).
- Facebook templates are extremely handy. There are over 80 million small business pages listed on facebook that are used on a monthly basis. (IR Report, 2018)
- An approximated 90+ million small businesses are now using Facebook products and services. A majority of these are provided for free (IR Report, 2019).
- Facebook’s headcount is up 45% year-over-year, a growth metric Zuckerberg is using to justify their investment in industries like AR and VR (IR Report, 2019).
Facebook privacy and security statistics
- Facebook now employs more than 30,000 workers focused on Safety and Security features for its users as a result of controversies related to recent elections in the U.S. and faults in their transparency reports (Facebook Newsroom, 2019).
- More than half of Safety and Security employees are content Reviewers that cover all time zones and speak 50+ languages (Facebook Newsroom, 2018).
- Unreliable content on NewsFeeds has been reduced by an internal estimate of 80% according to Newsroom reports(Facebook Newsroom, 2018).
- Since transitioning to new platform security policies in 2014, 400+ apps violating these policies have been removed (Facebook Newsroom, 2018).
- In Q2 of 2018, more than 800 million fake accounts, with most being removed within minutes of registration (Facebook Newsroom, 2018).
- Q3 2018 saw 754 million fake accounts removed in the same fashion, thanks to proactive detection methods that have been implemented (Facebook Newsroom, 2018).
- Between July and September of 2018, 99.6% of content directly tied to fake accounts was detected before active users were able to report it (Facebook Newsroom, 2018).
- Fact-Checking processes are reported to have reduced future impressions of “false” rated content by 80% (Facebook Newsroom, 2018).
- Facebook now has 20 offices around the world that have teams dedicated to reviewing content for user safety and security (Facebook Newsroom, 2018).
|
TIP: Do you use Facebook regularly? Join your peers by writing a review!

|
Digital transformation and social media marketing
Facebook is helping consumers reach businesses every day (mostly for free), and the conversations they are having on apps like Messenger are helping businesses reach a diverse set of customers around the world.
Your opportunities on the platform are endless. Don’t miss out, and track progress with social media marketing software so you can stay ahead of the digital transformation curb.
Facebook is just one of the ways you can keep your business in the social media marketing loop.


 by Daniella Alscher
 by Alexa Drake
 by Matt Shealy
 by Daniella Alscher
 by Alexa Drake


